Affordable Cost Segregation in 2026: What $495–$795 Gets You
Traditional cost seg studies cost $5,000-$15,000. Ours start at $495. Here

A cost seg study has three ingredients: engineering cost data, MACRS classification rules, and a 30-page PDF defending every number. Traditional firms sell all three for $5,000–$15,000. We sell all three for $795. For standard residential and short-term rental properties, the core engineering output is the same — the difference is delivery model and overhead. For complex commercial properties over $5M with unusual construction, traditional firms can still justify their price.
“Affordable cost segregation” used to mean “a study that doesn’t cost more than your property.” At $5,000–$15,000, the traditional price only made sense for buildings over about $1M. For everything below that, the math was marginal at best, and firms stopped actively pursuing the work. That’s why most rental investors never heard of cost seg in the first place — the price point filtered them out. We cover the math for smaller properties specifically here.
The reason the price can be $795 isn’t mysterious. It’s not a “stripped down” study. It’s a different delivery model applied to the same engineering analysis. This post walks the line-item breakdown of what’s inside a $795 study, what traditional firms charge extra for, where each approach is actually justified, and what questions to ask any provider quoting any price.
The three ingredients of every cost seg study
Every legitimate cost seg study — $795 or $15,000 — contains the same three components. 1. Engineering cost data
Standard industry reference is RSMeans — the construction cost database that both we and traditional firms use. Updated quarterly. Prices every building component (flooring, HVAC, windows, framing, roofing, millwork, site improvements) by geographic market and quality tier. This is not a proprietary resource. Every reputable cost seg firm pulls from the same source data. 2. MACRS classification rules
The IRS publishes asset class definitions in Revenue Procedure 87-56 and the Cost Segregation Audit Techniques Guide. These tell you which components are 5-year property (personal property), 7-year (certain commercial equipment), 15-year (land improvements), 27.5-year (residential building), or 39-year (commercial building). Classification is rule-based. Two competent engineers working from the same component list should arrive at the same classifications. 3. A 40+ page report defending every number
Property description, methodology, data sources, component-level analysis, depreciation schedules, Form 4562 support, Form 3115 documentation for lookback studies, and audit-ready references to the ATG. This is what your CPA files from, and what defends the study if audited.
Those three ingredients produce a cost seg study. Neither the cost database nor the classification rules are proprietary to any firm. The report template has been stabilized for 20+ years. What varies between providers is how those ingredients get assembled — whether engineers visit the property in person, how the component identification is performed, how the report is built. That’s the delivery model. And delivery model is where the price difference lives. For a complete comparison of what different providers charge, see how study pricing works.
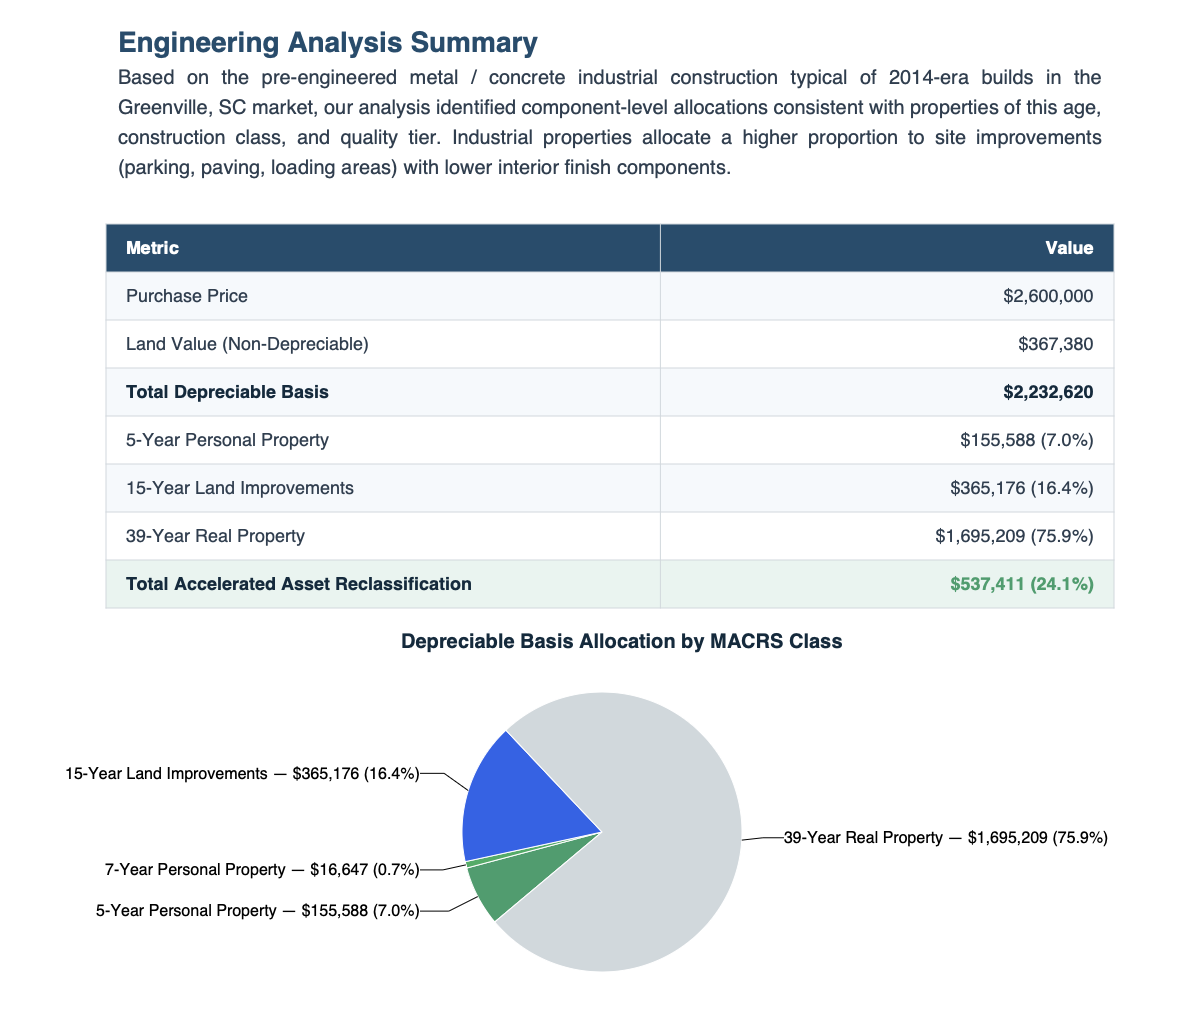
Sample engineering analysis summary page — MACRS class allocation, reclassified basis, and visual breakdown by recovery period. Standard across our reports regardless of property price.
Line-item breakdown: what $795 covers
Here’s what goes into a $795 Cost Seg Smart study.
| Line item | What it is |
|---|---|
| Property data collection | County assessor records (deed, tax assessment, parcel data), satellite imagery, street-level photography, listing data where available |
| Component identification | Automated parsing of property type, size, construction era, and regional characteristics against our component library (150+ asset categories) |
| RSMeans cost application | Current-quarter RSMeans pricing applied to identified components, adjusted for local cost index (geographic multiplier) |
| MACRS classification | Each component classified per Rev. Proc. 87-56 and ATG guidance — 5-year, 7-year, 15-year, 27.5-year, or 39-year |
| Depreciation schedules | Year-by-year MACRS tables for each asset class, including 100% bonus depreciation (where currently allowed) |
| Report generation | 40+ page engineering report with property description, methodology section, component analysis, schedules, and audit defense documentation |
| Form 3115 support | If property was placed in service before the current tax year, report includes the §481(a) catch-up calculation and documentation for Form 3115 filing |
| Audit support | Methodology section cites the ATG’s 13 principal elements; data sources documented; engineering logic traceable |
| CPA revisions | Free revisions if your CPA requests format or additional documentation changes |
| CPA-Ready Guarantee | Full refund if your CPA can’t work with the report |
That’s the complete list. Nothing is optional, nothing costs extra. For reference, Cost Segregation Reviews tracks current pricing across providers if you want to compare what’s in other firms’ packages at various price points.
What traditional firms charge extra for
Now the comparison. Here’s what typically goes into a $5,000–$15,000 traditional study that isn’t in a $795 study.
| Line item | What it adds |
|---|---|
| On-site engineer visit | One or two engineers travel to the property, typically a half-day to full-day walkthrough. Adds $1,000–$3,000 in travel, labor, and scheduling overhead. Not required by the IRS. |
| Manual component identification | Engineers identify components in person rather than from imagery and records. For unusual or specialty properties this adds real value; for a standard SFR or STR, the component list is the same either way. |
| Sales commission | Traditional firms typically pay sales reps 15–25% of study fee. On a $10,000 study, that’s $1,500–$2,500 going to commission, not engineering. |
| Scheduling queue | 4–8 week turnaround is standard. You’re paying for a slot in their engineering team’s pipeline. Automation eliminates the queue entirely. |
| Additional audit support hours | Some firms include extra audit consultation hours (beyond the written report) in their fee. Others charge hourly if you get audited. Varies by firm. |
Most of the price gap is the site visit and the sales commission. Together, those two items alone account for $2,500–$5,500 of the difference. The underlying engineering — cost database, MACRS classification, report generation — is similar in both models. Whether a site visit is actually required is covered in more detail here — short answer: no, the IRS Audit Techniques Guide does not require one.

A page from a finished Cost Seg Smart report. The components, cost data, and classifications are identical to what a $10,000 traditional study would produce on the same property — because the underlying RSMeans data and MACRS rules are industry standards.
Where traditional firms genuinely add value
When $10,000+ is actually justified
Mixed-use commercial buildings over $5 million. Ground-floor retail with upper-floor offices and structured parking has fundamentally different systems on each floor and genuinely benefits from on-site engineering judgment to identify specialty equipment, tenant improvements, and non-standard assets. Automation handles the obvious 80% of components; the remaining 20% is where in-person eyes earn their fee.
Properties with unusual construction or heavy recent renovations. Custom build-outs, specialty manufacturing equipment, historic properties with mixed original/replacement systems. In these cases, a competent engineer walking the site catches things a cost database alone won’t flag.
Specialty commercial: manufacturing, medical, lab facilities. Process equipment and specialty systems have tax implications that benefit from engineer judgment rather than automated classification. If your property has a $500K MRI machine or custom food-processing equipment, you probably want the on-site review.
Properties you’ll actively dispute in audit. If you’re planning aggressive reclassification percentages and expect IRS scrutiny, some owners prefer the written testimony of a PE-signed report from a well-known firm. Both approaches are legally defensible, but preference matters for peace of mind.
These are honest carve-outs. For the properties in these categories, a $10,000 study isn’t a bad deal — it’s matching the cost structure to the complexity of the work. For a standard SFR rental or a short-term rental, the component list is standard and the automation handles it. Our full guide to choosing a provider walks through more comparison questions.
What to ask any provider (any price)
Before ordering a cost seg study — ours or anyone’s — these are the questions worth asking. If a provider can’t answer them clearly, that’s information.
- What cost database do you use? RSMeans is the industry standard. Anything else, ask why.
- Will a licensed engineer review or sign the report? Full-service firms typically have a PE sign. Automated providers usually have engineer review without a PE signature — which is acceptable under the ATG but worth knowing.
- What’s included if I get audited? Written audit documentation is standard. Additional consultation hours vary. Clarify upfront.
- Can I see a sample report? Every legitimate provider should show you one. If they won’t, move on.
- What’s the turnaround? Ours is under an hour. Traditional firms run 4–8 weeks. Neither is better or worse — but know which you’re buying.
- What’s the refund or revision policy? “Works with your CPA or full refund” is the cleanest policy.
- Does pricing include Form 3115 support? For any property you bought in a prior year, this matters. Some firms charge separately. (Here’s how lookback studies work.)
Most of the $5,000–$15,000 industry operates in good faith and delivers real engineering value for properties that need it. Most of the $795 end of the industry is similarly legitimate for properties that don’t. For a deeper look at ROI multiples by property type and why the study-fee-to-savings ratio matters more than the absolute fee, see our ROI breakdown. We also cover why traditional firms charge $10K+ in detail. The failure mode on either end is a provider who can’t answer these questions — not the price tag itself.
See what $795 produces for your property
Run your numbers in 60 seconds — your purchase price, your tax bracket, your property type. Sample report available on request. See your numbers →
Frequently asked questions Is a $795 cost segregation study legitimate? ▾
Yes, for standard residential, STR, and most commercial properties. The price difference versus traditional $5,000–$15,000 studies is driven by delivery model, not methodology. Both approaches use RSMeans cost data, MACRS classification rules per Rev. Proc. 87-56, and produce 40+ page reports per the IRS Cost Segregation Audit Techniques Guide. The IRS does not require a physical site visit; it requires detailed component-level documentation, which automated providers produce remotely using satellite imagery, county records, and engineering cost databases.
how cost segregation studies work → What’s the difference between a $795 and a $5,000 cost seg study? ▾
The engineering methodology is similar. Both use RSMeans cost data, MACRS classification rules, and produce comparable engineering reports. The difference is delivery: a $5,000 study includes an on-site engineer visit (travel, labor, scheduling overhead) and typically a 4–8 week turnaround. A $795 study is performed remotely using satellite imagery, county assessor data, and automated engineering analysis, delivered in under 1 hour. For standard properties, the output is substantively the same. For complex commercial properties over $5M with unusual construction, the traditional model can add genuine value. Will my CPA accept a $795 cost seg study? ▾
Almost always, yes. The report includes everything a CPA expects: 40+ page engineering analysis, component-level MACRS classifications, year-by-year depreciation schedules, Form 3115 documentation for lookback studies, and audit-defense methodology per the IRS ATG. If your CPA has specific format preferences or additional documentation requests, we revise the report at no charge. If the report can’t be used, we refund. When should I pay for a traditional $10,000+ study instead? ▾
Mixed-use commercial buildings over $5M, properties with unusual construction or significant recent renovations, and specialty commercial buildings (manufacturing, medical, lab) with expensive non-standard equipment. In these cases, on-site engineer judgment catches components that automated classification may miss. For standard residential, STR, and most commercial under $5M, the engineering output is substantively similar, and the price premium doesn’t produce proportional value. Is a licensed engineer involved in a $795 study? ▾
Our studies use engineer-reviewed methodology and component libraries built by licensed engineers. The automated process applies that engineering logic to each property. For most residential and STR properties, this is equivalent to having an engineer perform the classification manually — because the classifications are rule-based applications of the ATG and Rev. Proc. 87-56, not subjective judgment calls. For properties where engineer judgment materially changes the outcome (complex commercial), we’d recommend a traditional firm or flag the property during intake. What if I want a sample report before ordering? ▾
We provide a sample on request — email support@costsegsmart.com and we’ll send a redacted sample for your property type (residential, STR, commercial). You can also see exactly what you get in our sample report. If you want to see the full deliverable before committing, that’s the right way to evaluate. Any legitimate provider should do the same.