Cost Segregation in Charleston, SC: $25K-$50K Year 1
Charleston rental and STR investors save $25K-$50K in Year 1 with cost segregation + 100% bonus depreciation. See real savings by property type.
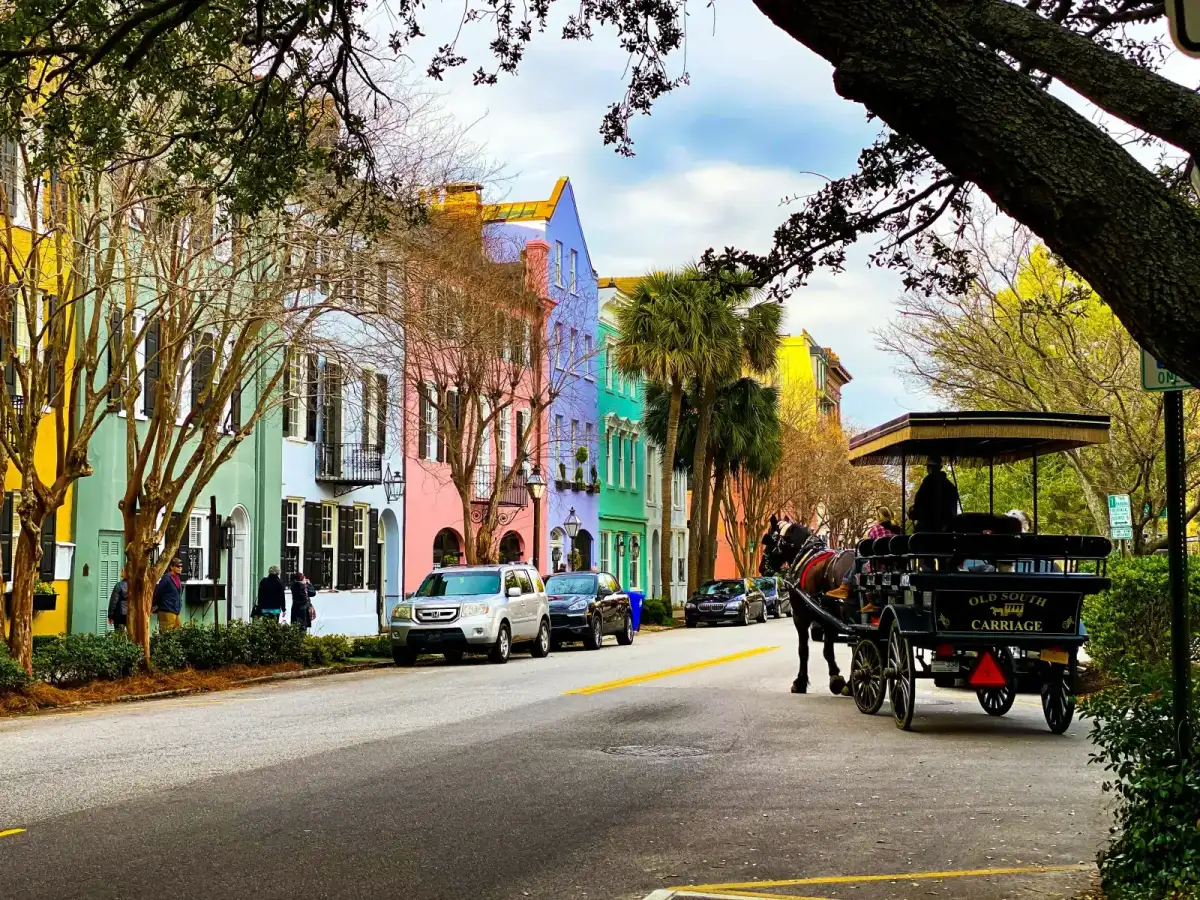
Charleston’s 150-year-old single houses have the exact profile cost segregation rewards — accumulated fixtures, original piazzas, brick courtyards, and decades of layered HVAC and plumbing systems. A $700K historic rental in Cannonborough or the French Quarter commonly reclassifies 26% of basis. Combined with South Carolina’s top 6.5% state rate, high-earning investors see $50K+ in first-year tax savings on a single property.
Why Historic Charleston Is Ideal for Cost Segregation
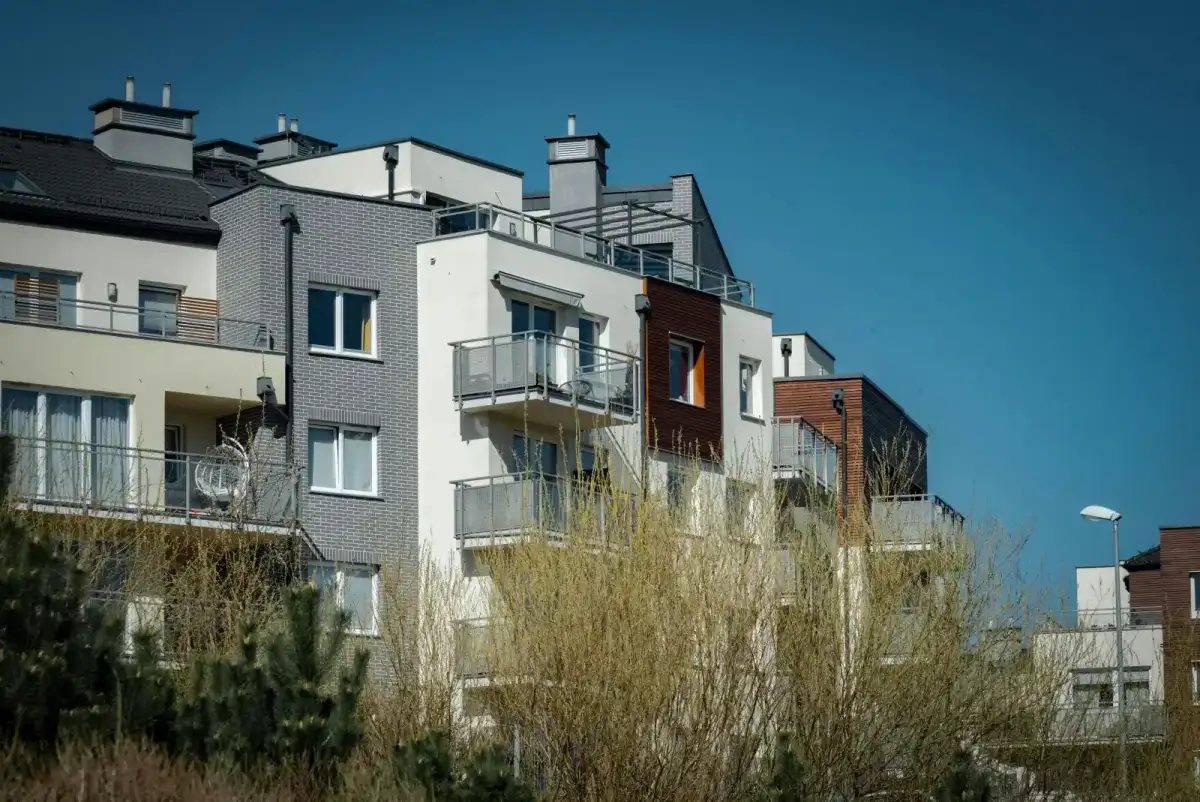
Charleston’s real estate market sits at a unique intersection: historic properties with high purchase prices, a thriving short-term rental economy, and construction that contains exactly the kind of components cost segregation studies are designed to identify. The median home price in Charleston County is approximately $485,000, but investor-grade properties south of the Crosstown — in the French Quarter, Harleston Village, South of Broad, and Cannonborough-Elliotborough — routinely trade between $600K and $1.2M.
Here’s what matters for depreciation: older buildings tend to have more reclassifiable components than newer construction. A 150-year-old Charleston single house has generations of accumulated fixtures, gas-to-electric conversions, plumbing upgrades, HVAC additions, exterior ironwork, piazzas, brick courtyard pavers, and garden walls — all of which can be classified as 5-year or 15-year property rather than the default 27.5-year schedule.
A cost segregation study identifies and reclassifies these components. With 100% bonus depreciation permanently restored by the One Big Beautiful Bill Act (signed July 2025), every reclassified dollar is deductible in Year 1.
Charleston Real Estate Market Snapshot Median Home Price
$500,000 Median Rental Property
$425,000 Avg STR Annual Revenue
$50,000 Property Tax Rate
0.57% State Income Tax
Up to 6.5% Construction Cost Index
Above Average
Top-tier STR market, historic district premium. Top investment areas: Downtown, Isle of Palms, Sullivan’s Island, Mount Pleasant.
Source: Public assessor data, Zillow, AirDNA estimates. Values are approximate metro-area medians.
Charleston’s STR Market: Tourism Drives the Numbers
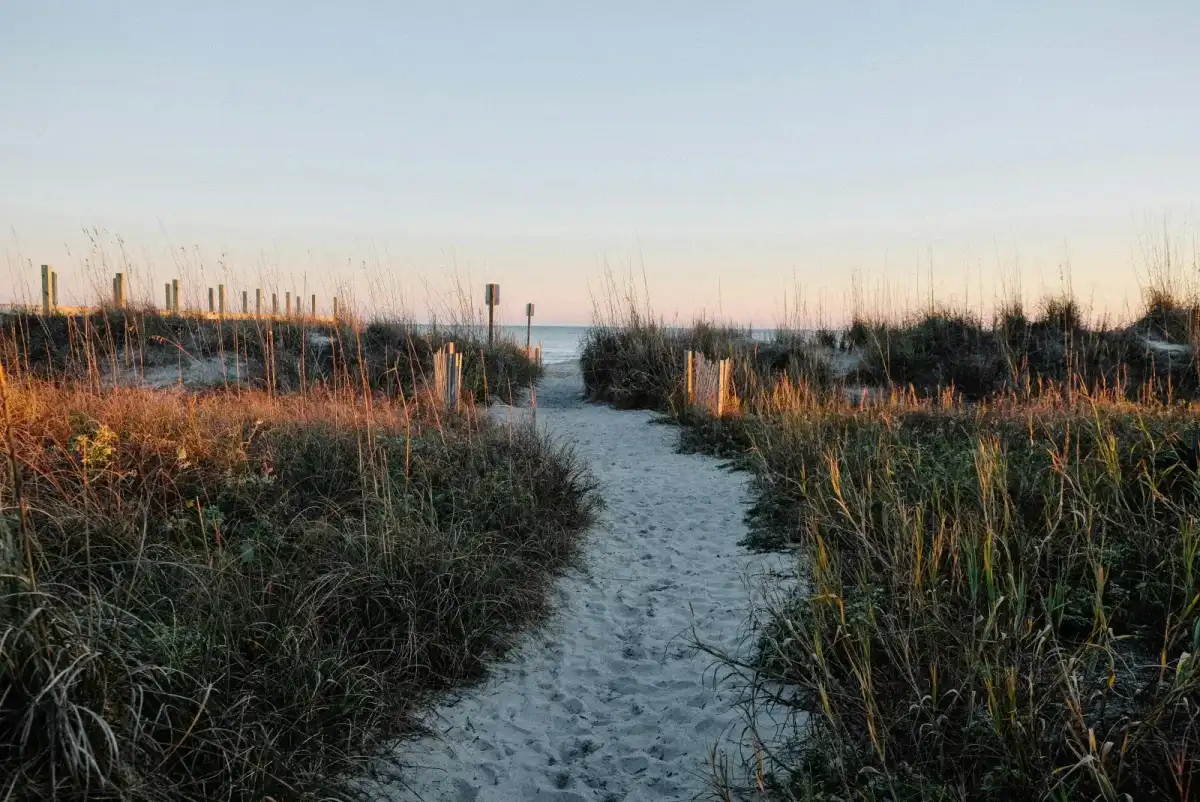
Charleston regularly ranks as the top U.S. city for tourism. The result: a robust short-term rental market, particularly in the peninsula and beach communities like Isle of Palms, Sullivan’s Island, and Folly Beach. The City of Charleston requires STR permits and enforces zoning restrictions, but permitted properties in the right zones generate strong revenue.
For STR owners who materially participate in managing their rental (the IRS threshold is 100 hours per year), losses from accelerated depreciation can offset W-2 wages, business income, and other active income. This is the material participation rule under IRC Section 469 — and it’s the reason high-income Charleston professionals who own STRs pursue cost segregation with particular urgency.
South Carolina’s state income tax tops out at 6.5%. Combined with federal rates, Charleston investors in the top bracket face a combined marginal rate above 43%. Every $100,000 in accelerated deductions saves over $43,000 in combined taxes.
A Real Example: 3BR Historic Home in Cannonborough-Elliotborough
The property: A 3-bedroom, 2-bathroom Charleston single house in Cannonborough-Elliotborough (29403), purchased in March 2023 for $625,000. Built circa 1910, renovated in 2019 with a new kitchen, updated bathrooms, refinished heart pine floors, and restored piazza. Operated as a furnished STR. The owner is a physician at MUSC with W-2 income of $290,000.
Without cost segregation: Depreciable basis (purchase price minus land) is approximately $468,750. Straight-line depreciation over 27.5 years: about $17,050 per year.
With cost segregation: The engineering-based study identifies approximately 26% of the depreciable basis as 5-year and 15-year property. The older construction vintage and renovation history push reclassification percentages higher than a typical newer property.
| Category | Amount | Year 1 Deduction |
|---|---|---|
| 5-Year Property (kitchen, fixtures, appliances, flooring, cabinetry, furniture) | $89,100 | $89,100 (100% bonus) |
| 15-Year Property (piazza, brick courtyard, landscaping, garden walls, fencing) | $32,700 | $32,700 (100% bonus) |
| 27.5-Year Property (remaining building structure) | $346,950 | $12,620 (straight-line) |
| Total Year 1 Accelerated Deductions | $121,800 |
At a combined 43%+ tax rate, that $121,800 in Year 1 deductions translates to approximately $52,400 in estimated tax savings. The study starts at $495. The ROI speaks for itself.
Charleston Neighborhoods: Where the Tax Math Works Best
South of Broad / French Quarter (29401): The most expensive properties in Charleston, often $1M-$3M+. Land allocations are high due to location premium, but the depreciable basis on these older buildings is substantial. Ironwork, historic fixtures, and courtyard improvements add to reclassifiable components.
Cannonborough-Elliotborough / Harleston Village (29403): The sweet spot for investor properties: $550K-$800K, often with recent renovations that create significant 5-year property. Renovation costs (kitchens, bathrooms, flooring) are prime cost seg targets.
Upper Peninsula / NoMo (North Morrison): Newer construction, more affordable ($400K-$550K). Lower reclassification percentages than historic properties, but still meaningful dollar amounts at today’s price points.
Isle of Palms / Sullivan’s Island: Beach vacation rentals, $900K-$2M+. Extensive outdoor improvements (decks, pools, dune walkovers, outdoor showers) classify as 15-year property. Fully furnished beach STRs regularly see 24-30% reclassification.
Mount Pleasant / James Island: Suburban investor territory ($400K-$650K). Newer construction with moderate reclassification percentages. Popular with long-term SFR investors.
The Lookback Study: You Haven’t Missed Your Window
If you purchased your Charleston property in 2020, 2021, or 2022 and have been taking straight-line depreciation, you can still capture the benefit. A lookback cost segregation study, filed via Form 3115 (change in accounting method), lets you claim all accumulated missed accelerated depreciation in a single tax year. No amended returns needed. The catch-up deduction can be substantial — especially for properties that have been in service for several years.
What You Receive
A 40+ page engineering-based PDF report with component-level depreciation schedules, IRS MACRS classifications, and methodology documentation designed for IRS scrutiny. Delivered in under an hour. Starting at $495 — a fraction of what traditional firms charge for the same deliverable.
how the classification process works →
Related Reading
- What Percentage Should You Actually Expect From a Cost Segregation Study? (Real Data, Not Marketing)
- How Cost Segregation Actually Shows Up on Your Tax Return
- Miami Real Estate Investors: Cost Segregation Could Claim $40K-$120K in Year 1 Tax Savings
See What Your Charleston Property’s Depreciation Breakdown Looks Like
Run the calculator on your specific property.
Getting Started
Provide your property address, purchase price, property type, year built, and any significant renovations or furnishings. We deliver an engineering-based cost segregation report. You hand it to your CPA. Charleston’s combination of high property values, historic construction, and active tourism makes cost segregation one of the most efficient tax strategies available to Lowcountry investors.
See the full Charleston cost segregation breakdown with calculator and sample report on our Charleston page.
Run the calculator on your specific property.